Author: Rachel Bridwell, MD (@rebridwell, EM Resident Physician, Brooke Army Medical Center) and Lloyd Tannenbaum (Staff Physician, Brooke Army Medical Center) // Reviewed by: Jamie Santistevan, MD (@jamie_rae_EMdoc – EM Physician, Presbyterian Hospital, Albuquerque, NM); Manpreet Singh, MD (@MPrizzleER – Assistant Professor of Emergency Medicine / Department of Emergency Medicine – Harbor-UCLA Medical Center); and Brit Long, MD (@long_brit – EM Attending Physician, San Antonio, TX)
Welcome to this edition of ECG Pointers, an emDOCs series designed to give you high yield tips about ECGs to keep your interpretation skills sharp. For a deeper dive on ECGs, we will include links to other great ECG FOAMed!
This week we continue a series on post myocardial infarction complications. Today we present a case of a patient who developed left ventricular aneurysm and discuss the diagnosis and treatment.
The Case:
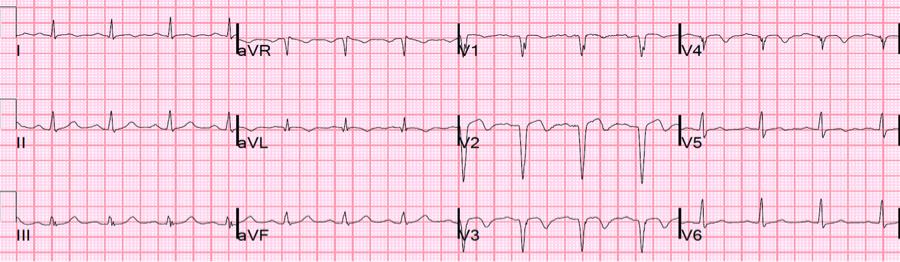
You are on an evening shift and an ECG gets handed to you, that looks concerning on first glance. The patient is a 57 year-old male brought in by his wife who became concerned when he started complaining about chest pain. He had an MI 4 weeks ago so she didn’t want to delay care. You smartly grab an old ECG which only shows normal sinus rhythm. What do you want to do?

In this ECG, we see V2-6 demonstrating significant ST elevation but there are no reciprocal depressions. Does this meet STEMI criteria? Should you activate the cath lab? Call cardiology?
ECG Changes in an Acute MI
There are many changes on an ECG that occur in an acute myocardial infarction. Hyperacute T-waves are some of the earliest markers of coronary artery occlusion. As time passes, the ST segments elevate, which is the eponymous ECG change related to STEMI. But what happens after the patient goes to the cath lab and the occlusion is reversed? Do the ST segments stay elevated forever?

This is a quick refresher of ECG changes that occur before, during, and after acute MI.1 Note that hyper acute T-waves can be one of the earliest markers of acute MI, but can be subtle, which stresses the importance of serial ECGs on patients presenting to the ER with chest pain.
Within 2 weeks of a STEMI, the ST segment returns to baseline while T-waves invert or flatten and Q-waves persist. In around 60% of patients with an anterior STEMI and only 5% of an inferior STEMI, there is a degree of persistent ST elevation secondary to transmural scar and incomplete reperfusion.2,3
What does the persistent ST elevation mean?
On ECG, these ST elevations, either concave or convex, will primarily be in the precordial leads with relatively diminished T-wave amplitude in comparison to the hyperacute T-waves of a STEMI. Persistent ST elevation after a STEMI can signify a left ventricular (LV) aneurysm. Differentiating LV aneurysm from STEMI is very challenging, as patients with an LV aneurysms are at high risk for cardiac pathology. If available, the crux of management is comparing the current ECG with an old ECG, which may show the persistent LV aneurysm pattern. Should that be unavailable, well formed Q-waves, absence of large or upright T-waves, lack of reciprocal changes or dynamic ST changes lean towards LV aneurysm.
There are 2 rule that were written and validated by Dr. Stephen Smith of the excellent Dr. Smith’s ECG blog:
Rule 1: If the sum of T-wave amplitudes in leads V1 to V4 divided by the sum of QRS amplitudes in leads V1 to V4 is greater than 0.22, then acute ST-segment elevation MI is predicted. 4
Rule 2: If any 1 lead (V1-V4) has a T-wave amplitude to QRS amplitude ratio greater than or equal to 0.36, then acute ST-segment elevation MI is predicted.4
Additionally, T-wave:QRS complex amplitude has been utilized to parse out STEMI versus LV aneurysm:
T wave: QRS >0.36 in ANY precordial lead=Anterior STEMI
T wave: QRS <0.36 in ALL precordial leads=LV aneurysm5
Patients with LV aneurysms are still at high risk of having an additional STEMI, which can be seen in the dynamic T-wave changes. Below is a 30 year-old male with previous MI, who is status-post LAD stent who developed LV aneurysm and is presenting with chest pain. While he has ST elevation in anterior precordial leads, also note the T-waves.

Notice the acute T-waves in the anterior leads best seen in V2/3/4. Thank you to Dr. Smith’s ECG blog6

His previous ECG shows LV aneurysm morphology of ST elevation, mild TWI, and QS-waves in V2-3. His T-wave amplitude: QRS amplitude is less than 0.36, consistent with LV aneurysm. Thank you to Dr. Smith’s ECG blog6Thank you to Dr. Smith’s ECG blog6
Comparing the first ECG to the second ECG (using V2), we see that initially, his T-wave amplitude is 0.9 mV and his QRS is 1.6 mV. His T:QRS ratio is 0.9/1.6 = 0.56, which by rule 2 is a STEMI. Looking at the second ECG (the old ECG) the T wave amplitude in V2 is 0.5 mV and the QRS is 2.2 mV. His T:QRS ratio is 0.5/2.2 = 0.22, consistent with an LV Aneurysm. In V3, his T wave amplitude is 0.27 mV and QRS amplitude is 1.0 mV. His T:QRS ratio is 0.27/1.0 = 0.27. These are the precordial leads with the largest QRS and T complexes, so we will use them as an example. Remember, that in order to apply rule two, you must check V1 – V4 to ensure that the T:QRS is less than 0.36.
Post PCI, the T-waves are inverted, representing reperfusion. Thank you to Dr. Smith’s ECG blog6
Management:
LV aneurysms generally portent a poor prognosis, with associated heart failure, CVA, ventricular arrythmia, occurring in 28% of patients with an MI.7,8 In a retrospective study of 1823 patients undergoing PCI, female sex, peak pro-BNP, duration of chest pain to reperfusion time, QS wave on initial ECG, and regional wall motion abnormalities in the anterior LV and apex were shown to be independent predictors of LV aneurysm acutely after STEMI.9 These patients are also at an increased risk of ventricular tachycardia and ventricular fibrillation after LV aneurysm in addition to thromboembolic events.10,11 While reperfusion is key to therapy in acute MI, point of care ultrasound can often identify these aneurysms. Other disease processes that can mimic this echocardiographic finding include LV diverticulum, post transapical approach for transcatheter aortic valve implantation, and takotsubo cardiomyopathy, though these entities require imaging beyond the scope of the ED.11,12 In the emergency department, the apical 4 view will provide the best view for assessing LV aneurysm which show a dilated ventricle with apical thin continuous ballooning structure.13

A very large left LV aneurysm is shown above.14
While these patients do not require emergent PCI, they should be admitted as they often require formal echocardiography, advanced imaging, and consideration of anticoagulation as these patients are at a high risk of arrhythmia and thromboembolic events.15
Case Conclusion:
Reexamining the ECG from our patient, we calculate the T:QRS amplitudes:
V1: 0.15/ 1.1 = 0.041
V2: 0.4 / 2.0 = 0.2
V3: 0.5/2.1 = 0.24
V4: 0.35/1.8 = 0.28
Thus, by rule 2, as all values are <0.36, the pt’s ECG is consistent with a LV aneurysm.
Confirming with rule 1, we see that the sum of the T-wave amplitudes in V1-V4 is 1.4 and the sum of the QRS amplitudes is 7.0. 1.4/7.0 = 0.2, which is less than 0.22, thus consistent with an LV aneurysm.
Given that the patient had such a recent MI and presented with chest pain, cardiology was consulted to urgently evaluate the patient. A CODE STEMI was not called. Cardiology came down and agreed that the ECG was consistent with an LV aneurysm and they performed a bedside echo that confirmed the aneurysm. The patient was admitted to the hospitalist service for further management.
The main pointers:
- Acquiring an old ECG is key to differentiating LV aneurysm from anterior STEMI, with a T-wave amplitude:QRS amplitude assisting in differentiation
- STEMI can be superimposed on LV aneurysm, and in this case the T-wave again becomes upright with higher amplitude.
- LV aneurysm patients are at very high risk of dysrhythmias and thromboembolic events
References:
- STEMI. https://www.saem.org/cdem/education/online-education/m3-curriculum/group-electrocardiogram-(ecg)-rhythm-recognition/stemi. Accessed March 7, 2020.
- Lucas LA, Somerville C. Left ventricular aneurysm. N Engl J Med. 2014;370(3). doi:10.1056/NEJMicm1307241
- Cabin HS, Roberts WC. True left ventricular aneurysm and healed myocardial infarction: Clinical and necropsy observations including quantification of degrees of coronary arterial narrowing. Am J Cardiol. 1980;46(5):754-763. doi:10.1016/0002-9149(80)90425-7
- Klein LR, Shroff GR, Beeman W, Smith SW. Electrocardiographic criteria to differentiate acute anterior ST-elevation myocardial infarction from left ventricular aneurysm. Am J Emerg Med. 2015;33(6):786-790. doi:10.1016/j.ajem.2015.03.044
- Smith SW. T/QRS ratio best distinguishes ventricular aneurysm from anterior myocardial infarction. Am J Emerg Med. 2005;23(3):279-287. doi:10.1016/j.ajem.2005.01.003
- Smith S. Dr. Smith’s ECG Blog: Search results for anterior lv aneurysm. https://hqmeded-ecg.blogspot.com/search?q=anterior+lv+aneurysm. Published January 22, 2015. Accessed March 7, 2020.
- Visser CA, Kan G, David GK, Kong Ing L, Durrer D. Echocardiographic-cineangiographic correlation in detecting left ventricular aneurysm: A prospective study of 422 patients. Am J Cardiol. 1982;50(2):337-341. doi:10.1016/0002-9149(82)90185-0
- Faxon DP, Ryan TJ, Davis KB, et al. Prognostic significance of angiographically documented left ventricular aneurysm from the Coronary Artery Surgery Study (CASS). Am J Cardiol. 1982;50(1):157-164. doi:10.1016/0002-9149(82)90023-6
- Zhang Z, Guo J. Predictive risk factors of early onset left ventricular aneurysm formation in patients with acute ST-elevation myocardial infarction. Hear Lung. 2020;49(1):80-85. doi:10.1016/j.hrtlng.2019.09.005
- Ning X, Ye X, Si Y, et al. Prevalence and prognosis of ventricular tachycardia/ventricular fibrillation in patients with post-infarction left ventricular aneurysm: Analysis of 575 cases. J Electrocardiol. 2018;51(4):742-746. doi:10.1016/j.jelectrocard.2018.03.010
- Xie M, Zhou H, Cheng TO, et al. Left ventricular apical aneurysm associated with normal coronary arteries following cardiac surgery: Echocardiographic features and differential diagnosis. Int J Cardiol. 2013;168(4):3665-3670. doi:10.1016/j.ijcard.2013.06.001
- Panduranga P, Al-Riyami AA. Coronary anomaly with a left ventricular accessory chamber: Is it left ventricular aneurysm or diverticulum? J Saudi Hear Assoc. 2012;24(3):191-194. doi:10.1016/j.jsha.2012.02.008
- Badano L, Piazza R, Bisignani G, Nicolosi GL. Echocardiographic features of left ventricular aneurysm and false tendon in a patient with postinfarction pseudoaneurysm after aneurysmectomy. G Ital Cardiol. 1993;23(3):295-299. http://www.ncbi.nlm.nih.gov/pubmed/8325467. Accessed March 7, 2020.
- Echocardiography | Clinical Gate. https://clinicalgate.com/echocardiography-5/. Accessed March 7, 2020.
- Rowin EJ, Maron BJ, Haas TS, et al. Hypertrophic Cardiomyopathy With Left Ventricular Apical Aneurysm: Implications for Risk Stratification and Management. J Am Coll Cardiol. 2017;69(7):761-773. doi:10.1016/j.jacc.2016.11.063