Written by: David Cisewski, MD (@DHCisewski – EM Resident Physician, Icahn School of Medicine at Mount Sinai) and Stephen Alerhand, MD (@SAlerhand – Instructor of EM and Ultrasound Fellow, Icahn School of Medicine at Mount Sinai) //
Edited by: Manpreet Singh, MD (@MPrizzleER – Assistant Professor in Emergency Medicine / Department of Emergency Medicine – Harbor-UCLA Medical Center)

Case
63 year old male with known history of COPD, hypertension, and congestive heart failure presents with acute onset dyspnea. Patient notes an increased shortness of breath with exertion over last two days (must stop walking after three blocks), and requires three pillows to sleep since last night (normally one). Patient denies any specific triggers to his symptoms. Denies fever, chest pain, productive cough, or light-headedness. Of note, patient had a negative catheterization and a formal transthoracic echocardiogram four weeks prior to today’s visit which showed 36.9% ejection fraction and normal mitral and aortic valve function.
In the emergency room, the patient is noted to have the following vital signs:

Physical examination is notable for mildly increased work of breathing slightly relieved with 5L oxygen via nasal cannula (oxygen saturation – 93%), minimal crackles at the base of his lungs bilaterally, and 1+ pitting edema in bilateral lower extremities (patient indicates only slightly worse than usual).
Initial workup included a chest radiograph showing no evidence of effusion or consolidation compared to the prior discharge imaging four weeks prior. Initial electrocardiogram is as shown (consistent with previous):

Labs were as follows:

* BNP from prior admission – 301
Patient showed moderate improvement following 40 mg Lasix IV (home dose 40 mg PO) and was given the home dose of his metoprolol and enalapril after missing his morning dose. He continued to saturate 94% on nasal cannula weaned to 2L with no increased work of breathing after three hours in the emergency department . The patient indicated he had not quite returned to normal but feels substantially improved following treatment and rest.
The team is debating whether this was simply an acute exacerbation of congestive heart failure for which the patient can be monitored in an observation unit with close outpatient follow up and return precautions, or whether there is concern for a worsening congestive heart failure requiring admission. During the group discussion, the chief resident recalls an ultrasound technique used to extrapolate an estimated ejection fraction – E-point septal separation (EPSS) – that he believes could further help risk stratify the patient and assist in the disposition decision.
What is EPSS?
E-point Septal separation (EPSS) was first described during the 1970’s in which a great deal of interest began to be placed in the noninvasive echocardiographic evaluation of the left ventricle for assessing cardiac function (Massie, 1977). When the left ventricle relaxes during diastole, blood rushes through the mitral valve, swinging open the anterior mitral valve leaflet toward the interventricular septum. In the early stages of diastolic filling, the anterior mitral valve reaches a point of maximum excursion, and as such comes closest to the ventricular septum (E-point). The distance in space separating the anterior mitral valve leaflet from the septal wall is referred to at the E-point septal separation, or EPSS. EPSS can be thought of most simply as an estimation of left ventricle contractility and ejection fraction.
How to Acquire EPSS?
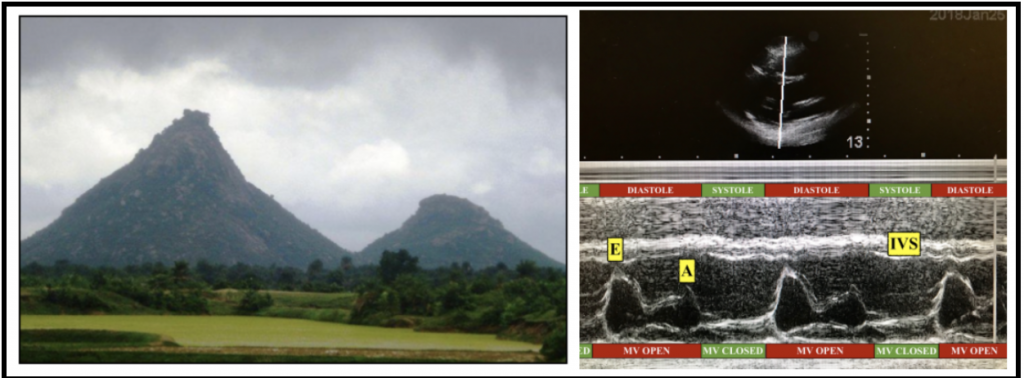
EPSS can be measured by direct ultrasound visualization of the heart in parasternal long axis (PLAX). Using M-mode, the marker is placed over the most distal tip of the anterior mitral leaflet. The M-mode image created using this point over time can be visualized as a cloudy sky over two hills (see Figure 1).

Figure 1 – E-point septal separation can be visualized as the space separating a mountain peak from the clouds (left); that is to say, the distance separating the peak height of the mitral valve (MV) – E-point – from the interventricular septum (IVS) motion during early diastolic filling on M-mode (right). A-point (A) represents the atrial kick that occurs as the left atrium contracts, re-extending open the mitral valve leaflet just prior to ventricular contraction.
The clouds signify the straight M-mode lines measuring the movement of the ventricular septum.
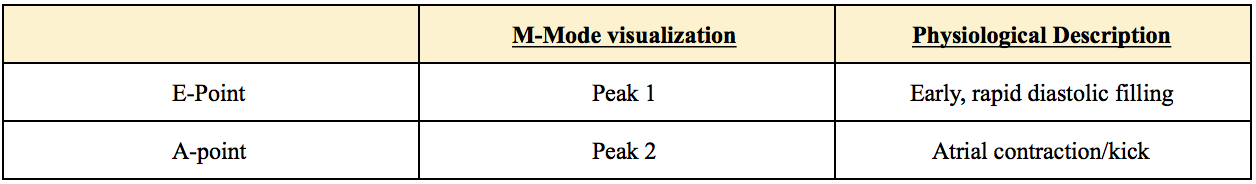
Typically there is little movement of the septum compared to the valve leaflets creating a relatively homogenous streak of parallel lines across the superior surface of the M-mode image. The two hills represent the E-point and the A-point. The E-point, as mentioned, represents the point at which the mitral valve leaflets travel closest toward the ventricular septum. It represents early, rapid diastolic filling. The second hill, or A-point, represents the atrial kick that occurs as the left atrium contracts, re-extending open the mitral valve leaflet just prior to ventricular contraction.
A normal, healthy anterior mitral valve leaflet may come in contact with the septum creating zero distance of E-point separation (Massie, 1977). As a strained heart begins failing to pump against an elevated systolic afterload, the left ventricle expands. This expansion results in decreased contractile forces, the consequences of which is a reduced ejection fraction – the original observation made by the early LVEF studies (Massie, 1977; Strunk, 1975; Ahmadpour, 1983). These same research studies demonstrated an inverse correlation between EPSS distance and ejection fraction – i.e., as the left ventricle size expands to compensate for decreased stroke volume, the mitral valve flow fails to keep pace,causing an increased space, or separation, between the valve and septum (Massie, 1977; Ahmadpour, 1983). Specifically, it was demonstrated that a EPSS >7mm was 87% sensitive (75% specific) at identifying reduced LVEF (<50%) compared to other studies (Ahmadpour, 1983). 7mm has since been accepted as the general cut-off for abnormal EPSS.
Support for EPSS
Within certain circles of the ultrasound community, EPSS has become a utilized estimation for LVEF estimation and cardiac function. The technique is simple to learn, requires a single transthoracic view and a single linear measurement, and perhaps most importantly it is not dependent on global ventricle contours or overall patient body habitus (Mark, 2007). In one prospective cross-sectional study, PLAX was shown to be the most favored cardiac view due to limited physiological barriers and optimal estimation of LVEF (Mckaigney, 2014; Mark, 2007). In addition, the isolated bedside view requires limited patient repositioning and less bedside time spent on maneuvering the patient for optimal view. Further studies have shown that EPSS offers a quantifiable value with limited subjectivity or inter-user variability as compared to other techniques used (Ginston, 1985).
Limitations of EPSS
As with all diagnostic tests, however, limitations do exist with acquiring and interpreting EPSS. Both mitral stenosis and aortic regurgitation can give false positive EPSS elevation, as both cause an abnormally increased distance between mitral valve and septal wall during diastole (Massie, 1977; Ahmadpour, 1983). As a result, the present of any valvular deformities or abnormalities excludes the use of EPSS in estimating left ventricular function.
How has EPSS been used in the ED?
One prospective observational study demonstrated that EPSS measured by emergency physicians had close correlation with left ventricle ejection fraction as measured by transthoracic echocardiography (TTE) (McKaigney, 2014). This same study demonstrated that contrary to other studies, visual estimation was only moderately correlated to LVEF despite advanced ultrasound training of the emergency physicians providing the estimates (McKaigney, 2014). Worth noting, the observers in this study were emergency ultrasound fellows with training in both visual and calculated LVEF but only a ten-minute didactic session on EPSS measurement and three supervised measurements with a principal investigator. This success following a limited training duration suggests the possibility of a small learning curve for EPSS use.
EPSS has also been shown to produce LVEF estimations among emergency residents that accurately correlated with the visual estimation of experienced emergency physicians and trained cardiologists (Secko, 2011). This evidence suggests EPSS could function as a complementary tool to be used by new emergency medicine residents and fellows as they gain experience – i.e., experience that only comes with time – in visual estimations of cardiac function.
Expanding research has demonstrated that an estimate of left ventricular ejection fraction could be extrapolated from the EPSS and used as an adjunct to the EPSS value (Silverstein, 2006). The formula that was derived from their calculations [LVEF = 75.5 – (2.5 x EPSS)] allows EPSS to be utilized as a continuous variable in assessing LV function as opposed to the dichotomous classification of “normal” or “abnormal” provided by previous EPSS researchers (Silverstein, 2006).
![]()
Wait, didn’t I hear we can just ‘eyeball’ ejection fraction?
Previous studies have demonstrated that visual estimation of left ventricular ejection fraction correlate well with quantitative estimation (Shigaldi, 2009). However, it is worth noting that the visual estimates in this study were performed with experienced readers under controlled settings. Hence, a major limitation of visual estimation is overall experience levels. It would be inappropriate to generalize this estimation skill to an emergency medicine resident or freshly minted attending performing a bedside echocardiogram in a busy emergency department. Nevertheless, this does study does provide confidence that in an acute setting where an overall qualitative assessment is all that is necessary to assess cardiac function, it can be done with relative accuracy.
Unluer, et al were able to demonstrate visual estimations of LVEF without the use of specialized techniques such as EPSS (Unluer, 2013). However, it must be noted that the outcome was based on a categorical diagnosis – low versus normal ejection fraction – rather that a specific quantitative estimate of the ejection fraction percentage (Unluer, 2013). In utilizing EPSS as an assessment tool, further quantifiable evidence is of great utility, extending beyond normal versus low estimation of LVEF.
Any new data on EPSS?
The identification of an accurate assessment of left ventricle ejection function continues to be a priority within the ultrasound community, though no universal bedside ultrasound technique exists to accurately estimate left ventricle ejection fraction.
Despite the promise seen in early studies utilizing EPSS, widespread acceptance of the technique has not been demonstrated. Many argue that a lack knowledge regarding the technique and failure to validate the Silverstein formulation for LVEF computation have been the major barriers to its popularity. Nevertheless, many centers continue to teach this as a risk stratification tool in patients with concerning cardiac functionality. A recent study once again demonstrated that a short didactic session using video clips to train novice ultrasound users on how to utilize EPSS resulted in a significant post-didactic improvement in the ability to differentiate normal (<8mm) versus elevated (>8mm) EPSS (Jacob, 2017). This study was consistent with previous findings that short didactic sessions resulted in improved assessment of cardiac function (Moore, 2002; Randazzo, 2003). Though not quantifiable, these results do show the feasibility of a short training module to further the use of this tool with success.

Back to the case
The attending agrees with the chief resident’s plan to assess the patient’s EPSS. The parasternal long-axis (PLAX) view shows no evidence of aortic regurgitation or mitral stenosis. EPSS is measured at 15.31. Using the formula (EF = 75.5 – 2.5 x EPSS), the ejection fraction is estimated to be 37.2%, relatively consistent with patient’s previous measurement of 36.9%. With the patient feeling improved following treatment and the estimate ejection fraction suggesting no worsening of left ventricular function, a more comprehensive clinic picture is made using the added data. In lieu of an admission for further assessment, the patient was transferred to Observation where he continued to show symptomatic improvement up until discharge the following morning.
Bottom Line on EPSS
EPSS is a simple, easy to learn tool that allows a quick estimation of left ventricular function. The value of EPSS lies in its objective findings that do not require specialized training for interpretation and utilization, as shown by numerous studies. In patients without mitral or aortic valvular pathology, EPSS can be obtained from a single echocardiography view, providing quantifiable information on heart function within minutes. EPSS >7mm is typically cited as the cut-off for abnormal ejection fraction (<50%). EPSS offers a further tool for inexperienced emergency physicians that can be used to complement the overall assessment and risk stratification of patients with congestive heart failure.
Deep Dive – What is the driving force behind risk stratification tools to measure the degree of congestive heart failure?
As emergency medicine physicians we have confidence in identifying low-risk CHF patients. These are the patients who respond immediately to therapy, show no other evidence of ischemia or high-risk symptoms, and may be safely discharged with plans for close follow up and return precautions. As well, we can identify the high-risk patients who demonstrate a limited response to treatment and/or signs of ischemia indicating a progressive decompensation. These are the patients we feel comfortable admitting to the hospital. However, it is the vast majority of intermediate-risk patients who show a partial response to treatment that remain a challenge to our disposition and for whom a further diagnostic assessment is required.
A report published in 2013 indicated that only a small fraction of the approximately 800,000 patients admitted to the hospital for CHF were in need of services beyond a period of observation (Collins, 2013). Despite admission, only a limited number of patients go on to receive advanced care or diagnostic testing beyond symptomatic treatment and IV diuretics; that is to say, very few require a level of monitoring beyond what could be provided in an observation unit. The authors of this study have argued there is a sizable subset of ED patients with heart failure who would benefit from a period of observation and symptomatic treatment, thus avoiding an inpatient admission (Collins, 2013).
The onus of this disposition ultimately falls on the emergency medicine team in first contact with the patient. The question remains, however, what do emergency medicine physicians have in their diagnostic tool belt that can be use to properly identify patients requiring admission versus observation/discharge? Many emergency physicians will allow the chest radiograph to guide their decision toward whether to disposition a patient to observation versus admission. However, this method lacks sensitivity as studies have demonstrated up to 15% of CHF in acute decompensation will lack radiographic evidence (Collins, 2006; Weintraub, 2010). With the advancements in ultrasonography and a recent push for bedside portable equipment use, a bedside echocardiography continues to demonstrate the highest utility in risk stratification. Diagnostic proxies such as EPSS may prove to be a key to identifying the subset of CHF patients who could be safely observed for symptomatic treatment.
For further discussion on EPSS, please see The Ultrasound Podcast with Dr. Mike Mallin and Dr. Matt Stone (the original inspiration for this post): http://www.ultrasoundpodcast.com/?s=epss
References
- Massie BM, Schiller NB, Ratshin RA, Parmley WW. Mitral-septal separation: new echocardiographic index of left ventricular function. Am J Cardiol. 1977;39(7):1008-16.
- Strunk BL, Guss SB, Hicks RE, Kotler MN. Echocardiographic recognition of the mitral valve-posterior aortic wall relationship. Circulation. 1975;51(4):594-8.
- Ahmadpour H, Shah AA, Allen JW, Edmiston WA, Kim SJ, Haywood LJ. Mitral E point septal separation: a reliable index of left ventricular performance in coronary artery disease. Am Heart J. 1983;106(1 Pt 1):21-8.
- McKaigney CJ, Krantz MJ, La Rocque CL, Hurst ND, Buchanan MS, Kendall JL. E-point septal separation: a bedside tool for emergency physician assessment of left ventricular ejection fraction. Am J Emerg Med. 2014;32(6):493-7.
- Secko MA, Lazar JM, Salciccioli LA, Stone MB. Can junior emergency physicians use E-point septal separation to accurately estimate left ventricular function in acutely dyspneic patients? Acad Emerg Med. 2011;18(11):1223-6.
- Silverstein JR, Laffely NH, Rifkin RD. Quantitative estimation of left ventricular ejection fraction from mitral valve E-point to septal separation and comparison to magnetic resonance imaging. Am J Cardiol. 2006;97(1):137-40.
- Mark DG, Ku BS, Carr BG, Everett WW, Okusanya O, Horan A, et al. Directed bedside transthoracic echocardiography: preferred cardiac window for left ventricular ejection fraction estimation in critically ill patients. Am J Emerg Med. 2007;25(8):894-900.
- Ginzton LE, Kulick D. Mitral valve E-point septal separation as an indicator of ejection fraction in patients with reversed septal motion. Chest. 1985;88(3):429-31.
- Shahgaldi K, Gudmundsson P, Manouras A, Brodin LA, Winter R. Visually estimated ejection fraction by two dimensional and triplane echocardiography is closely correlated with quantitative ejection fraction by real-time three dimensional echocardiography. Cardiovasc Ultrasound. 2009;7:41.
- Unluer EE, Karagoz A, Akoglu H, Bayata S. Visual estimation of bedside echocardiographic ejection fraction by emergency physicians. West J Emerg Med. 2014;15(2):221-6.
- Moore CL, Rose GA, Tayal VS, Sullivan DM, Arrowood JA, Kline JA. Determination of left ventricular function by emergency physician echocardiography of hypotensive patients. Acad Emerg Med. 2002;9(3):186-93.
- Randazzo MR, Snoey ER, Levitt MA, Binder K. Accuracy of emergency physician assessment of left ventricular ejection fraction and central venous pressure using echocardiography. Acad Emerg Med. 2003;10(9):973-7.
- Collins SP, Pang PS, Fonarow GC, Yancy CW, Bonow RO, Gheorghiade M. Is hospital admission for heart failure really necessary?: the role of the emergency department and observation unit in preventing hospitalization and rehospitalization. J Am Coll Cardiol. 2013;61(2):121-6.
- Collins SP, Lindsell CJ, Storrow AB, Abraham WT, Adhere Scientific Advisory Committee I, Study G. Prevalence of negative chest radiography results in the emergency department patient with decompensated heart failure. Ann Emerg Med. 2006;47(1):13-8.
- Weintraub NL, Collins SP, Pang PS, Levy PD, Anderson AS, Arslanian-Engoren C, et al. Acute heart failure syndromes: emergency department presentation, treatment, and disposition: current approaches and future aims: a scientific statement from the American Heart Association. Circulation. 2010;122(19):1975-96.


5 thoughts on “US Probe: E-Point Septal Separation (EPSS) in the CHF Patient”
Pingback: LITFL Review 319 | Edwin M. Thames
Pingback: Länkar v11-12 | Internmedicin
Pingback: emDOCs.net – Emergency Medicine EducationMyths in Heart Failure: Part I – ED Evaluation - emDOCs.net - Emergency Medicine Education
Pingback: LITFL Review 319 • LITFL Medical Blog • FOAMed Review
Great post, David.
I believe another useful tool to identify AHF patients suitable for discharge could be the Ottawa Heart Failure Risk Score (OHFRS) by Stiell, et al. (https://doi.org/10.1111/acem.12056,
validation https://doi.org/10.1111/acem.13141).
According to history, examination with 3-min walk test, and investigation, a total score is derived; if the score is 0, the risk of adverse event is less than 3%, and the patient could be discharged with close follow-up.