Author: Luigi Varilla, MD (EM Resident Physician, Harbor-UCLA Medical Center) and Jonathan Warren, MD (Clinical Ultrasound and EMS Fellow, Harbor-UCLA Medical Center) // Reviewed By: Steve Field, DO; Brit Long, MD (@long_brit)
Case
A 42-year-old male with no past medical history presents to the emergency department in respiratory distress. He is noted to have a history of methamphetamine use and describes a two-week history of progressive dyspnea and inability to lay down flat at night. He has resorted to sleeping in his reclining chair as a result. Vital signs are notable for respiratory rate of 26 with SpO2 of 90%. You suspect that the patient may be in new heart failure based on his history and wonder how best to confirm your diagnosis while labs are pending.
Introduction
Left ventricular ejection fraction (LVEF) via echocardiography continues to be the most validated and common measure of systolic function1. With increasing availability for ultrasound to specialists outside of cardiology, there is increased need for training of physicians to estimate LVEF, including some artificial intelligence (AI) tools which can supplement a provider’s skill and knowledge2. In the emergency department (ED), bedside echo is widely used to distinguish presentations of anasarca and respiratory distress. Although emergency physician’s qualitative interpretation of LVEF through visual estimation often correlates with qualitative measurements3,4, emergency physicians should be empowered to obtain and interpret both qualitative and semi-quantitative measurements of LVEF.
There have been a variety of proposed mechanisms to estimate LVEF each with their own benefits and limitations within the emergency department. Providers would benefit from knowing 2-3 different methods which can be employed to estimate LVEF at the bedside.
These methods are the following:
– E-Point Septal Separation (EPSS)
– Mitral Annular Plane Systolic Excursion (MAPSE)
– Fractional Shortening (FS)
– Fractional Area Change (FAC)
– Biplane (Simpson’s) Method
Moreover, knowledge of proper LVEF estimation technique is crucial as AI becomes more prominent to maintain quality assurance and quality of measurements that are obtained.
End-Point Septal Separation (EPSS)
Introduction
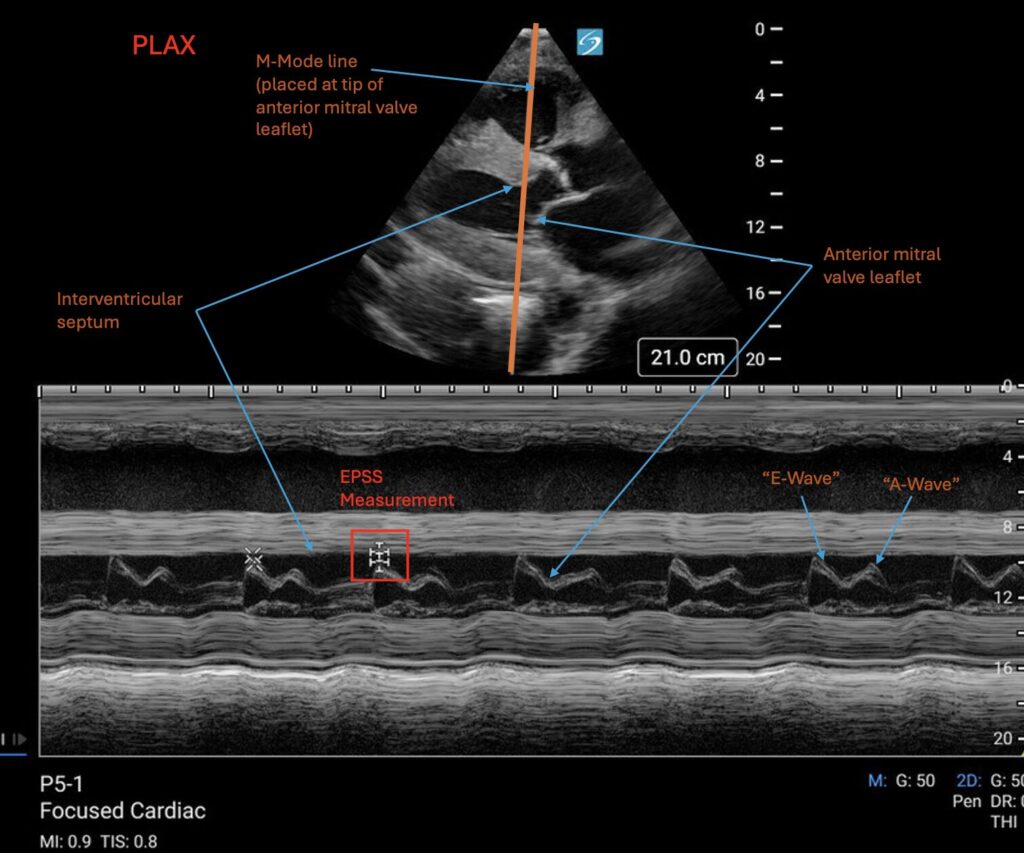
EPSS, simply put, is the minimal distance measured between the end of the anterior mitral leaflet and the interventricular septum during a cardiac cycle, occurring in early diastole5. It was first described in 1977 by Massie et al. and was found to have a strong negative correlation with ejection fraction, such that a higher EPSS correlated with a more diminished LVEF5. Because of its simplicity, EPSS remains as a widely used qualitative LVEF estimate used in many ED’s. This has also been previously covered in more depth in another article on EMDocs (https://www.emdocs.net/us-probe-e-point-septal-separation-epss-in-the-chf-patient/).
How to do
EPSS is measured in the parasternal long axis (PLAX) view of the heart. In the PLAX view, M-mode is placed over the most distal tip of the anterior mitral valve leaflet. The standard image you will obtain should look like two mountains (the anterior mitral valve tip during diastole) underneath a thick band (interventricular septum). The two mountains are named the E-wave and the A-wave which correspond to the two phases of LV filling from LV relaxation and the atrial kick, respectively. In patients with compliant hearts, the atrial kick contributes less to LV filling and therefore is the smaller of the two mountains, coming after the E-wave. The distance between the highest point of the mountains (usually the top of the E-wave) and the bottom of the band (interventricular septum on the LV side) is taken as the EPSS.
Normal values
Massie et al described that a normal, healthy anterior mitral valve leaflet comes in contact with the interventricular septum, correlating to an EPSS measurement of 0mm. As the left side of the heart begins to strain, the EPSS increases5 with one studying claiming EPSS of more than 7mm being 87% sensitive for identifying a LVEF of less than 50%6 while others claim that an EPSS measurements of more than 13mm in the ED is sensitive for severe systolic dysfunction (LVEF≤35%)7. Therefore, an EPSS of <7mm is generally used as normal and those with EPSS measurements above >7mm should warrant further work up and measurements of 13mm or more correlate with severely decreased EF.
Limitations
As the focus of EPSS is the anterior mitral valve, any structural abnormalities involving the valve limits the utility of EPSS. Mitral stenosis, for example can lead to false elevations of EPSS due to mitral valve stiffness5. Aortic regurgitation may limit normal mitral anterior leaflet motion if there is significant regurgitation of a column of blood and may also lead to falsely elevated EPSS measurements5.
Additionally, since the mitral valve opening is related to atrial pressures, dysrhythmias such as atrial fibrillation or significant tachycardia where there is variable or decreased LV filling from the left atrium can lead to falsely elevated EPSS5.
Lastly, it has been shown that EPSS has a weak correlation with ventricular size, therefore, EPSS may have limitations in calculating LVEF in patients with dilated cardiomyopathies5.
MAPSE
Introduction
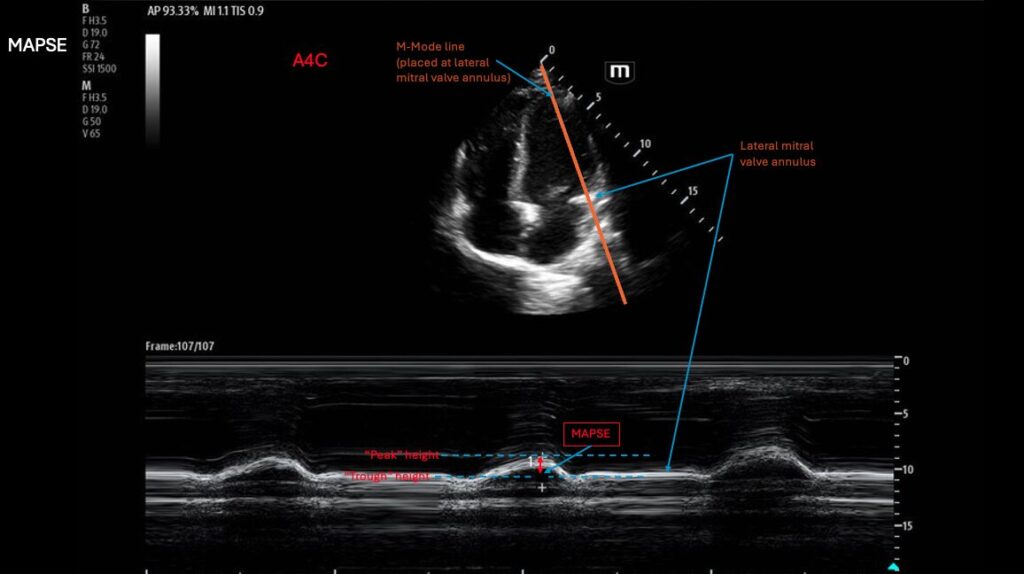
The Mitral Annular Plane Systolic Excursion (MAPSE) is a measurement of vertical movement (towards and away from the apex) of the mitral annulus during the cardiac cycle. This vertical movement can be used as an assessment of the change in the size of the left ventricle and, thus, as an estimate for the volume change of the left ventricle. Studies have shown that a decreased MAPSE correlates with reduced LVEF8 and has been proven to have clinical significance and can even help identify early and subtle systolic dysfunction9. In the ED, MAPSE measurement is particularly useful due to its technical simplicity, higher specificity compared to qualitative assessments10, and ability to use even if optimal views are not obtainable11.
How to do
MAPSE is measured in the apical 4 chamber view (A4C) of the heart. In the A4C, M-mode is placed over the lateral mitral annulus. M-mode here should show a wave form with peaks and troughs, representing the vertical movement of the mitral annulus. Calipers are then used to measure the magnitude of displacement of the annulus, giving the MAPSE in mm.
Normal values
Previous studies have shown that a MAPSE of >10mm was 92% sensitive and 87% specific for an LVEF of >55%12 and other studies have shown similar findings that a MAPSE of >10mm had an acceptable correlation to normal LVEF13,14. On the other hand, when patients with severe congestive heart failure were studied, it was shown that a MAPSE of <7mm was 92% sensitive and 67% specific for severely depressed LV systolic function, defined as LVEF <30%13.
Therefore, MAPSE measurements of >10mm are defined as normal, or correlated with good LVEF, while measurements of <7mm are associated with significantly decreased LVEF. Abnormal values of MAPSE may also provide suggestion of HFpEF if not previously identified15.
Limitations
Because MAPSE is a measurement of mitral valve excursion, mitral valve abnormalities, such as calcifications, can have a direct effect on MAPSE making measurements unreliable in these situations. Additionally, since MAPSE is a measurement of the longitudinal function of the heart, regional wall abnormalities can theoretically affect MAPSE. Variations in the angle of M-mode in relation to the heart’s placement can influence MAPSE measurements and should be interpreted carefully in situations where the apex is mobile, such as in large pericardial effusions16.
Fractional Shortening (FS)
Introduction
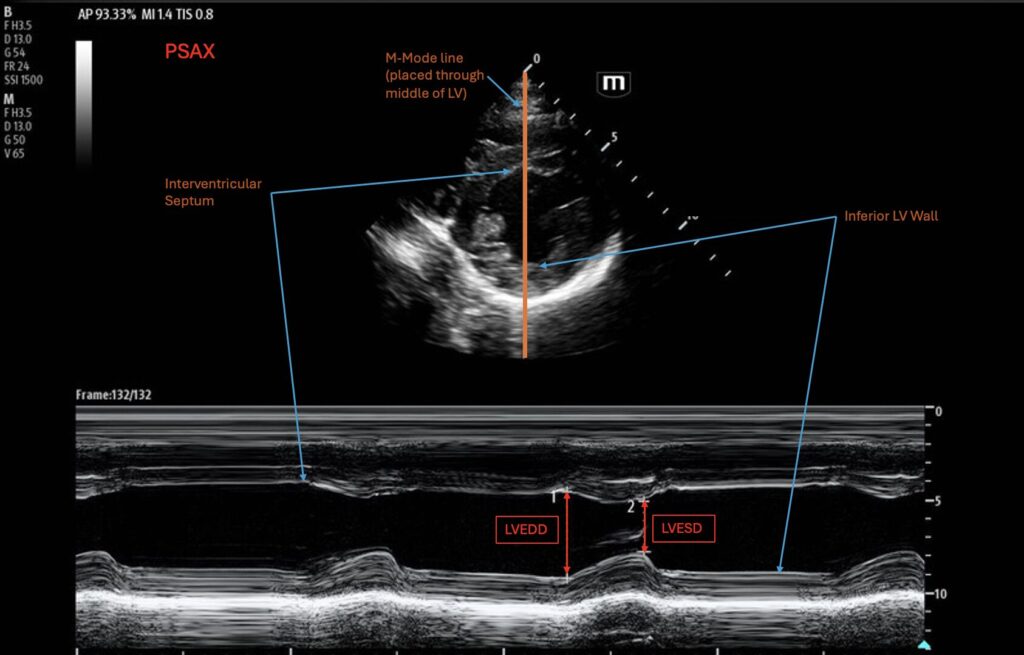
Fractional shortening (FS) is the fraction that the left ventricle shortens, on specific axes, during a cardiac cycle, comparing LV end-diastolic diameter (LVEDD) and LV end-systolic diameter (LVESD). This simplified method came about when Quinones et al sought a way to estimate LVEF directly through the images obtained without the need for computer assistance for calculations17. Mathematically, fractional shortening is calculated as:
FS% = (LVEDD – LVESD)/LVEDD x 100%
This simplified measurement of LV shortening was compared to radionuclide and angiography techniques and were found to have comparable translations in quantifying LVEF over a wide range of EF’s17. It’s simplicity and measurements in views already taken in traditional POCUS makes it a feasible quantitative estimate for LVEF in the ED.
How to do
FS can be measured in the parasternal long axis (PLAX) view or the parasternal short axis (PSAX) at the level of the mid-ventricle (papillary muscles). M-mode is used and placed in the middle of the LV. At this stage, it is important to make sure the M-mode is not capturing the mitral valve or the papillary muscles. On the M-mode tracing, two measurements of LV diameter are taken via the distance between the anterior and posterior walls of the ventricle at end-systole and at end-diastole. These diameter measurements of LVEDD and LVESD are taken, and most modern US machines will calculate the percent fractional shortening based on the equation above. It is important that this measurement should be taken when you are directly perpendicular to the ventricle.
Normal values
Although fractional shortening is calculated as a percent, it is important to note that it is calculating a distance rather than a volume, so the normal ranges do not directly represent EF%, although these measurements can be used to derive an EF% through Teichholz equation18:
Vd = [7/(2.4 + LVEDD)] x LVEDD3
Vs = [7/(2.4 + LVESD)] x LVESD3
LVEF = (Vd – Vs)/ Vd
The normal range for FS is 25-43% for men and 27-45% for women19. A measurement less than 15% corresponds to severely reduced LVEF of less than 30%7,19.
Limitations
Taking the diameter of the LV at one plane as an estimate for the global EF does not account for the longitudinal shortening of the heart. Therefore, regional wall abnormalities can present a problem as they may not be seen in radial or axial shortening20. Additionally, if you are not perpendicular to the ventricle, due to the cylinder tangent effect, you may false decrease the estimation of EF.
Fractional Area Change (FAC)
Introduction
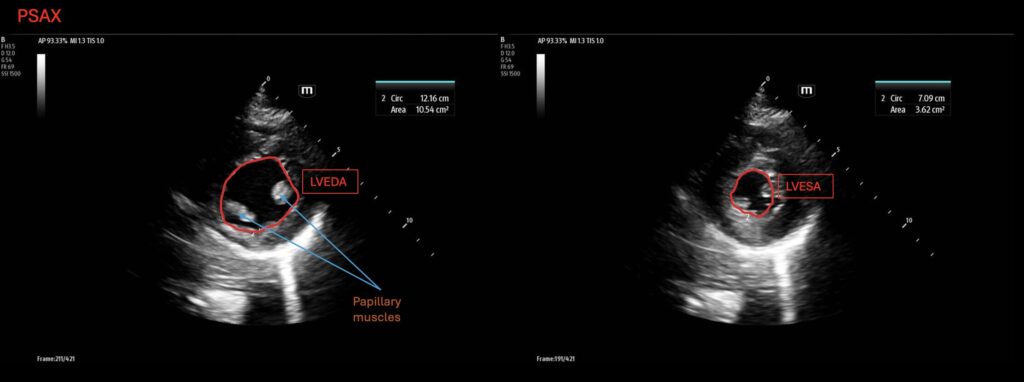
FAC is calculated using a traced LV circumference to obtain the delta area of the LV at end-diastole (LVEDA) vs at end-systole (LVESA) as an estimate for LVEF. It is calculated with the equation:
FAC = (LVEDA−LVESA)/LVEDA×100%
It came after methods of using biplane angiography to measure LV volumes were applied to cross-sectional echocardiography and was shown to be useful in determining LVEF21. With the advent of more advanced ultrasound machines that can automatically trace and calculate area and FAC with comparable accuracy to other methods22, FAC has become a more feasible quantitative estimate of LVEF in the ED.
How to do
Typically, FAC is calculated through a parasternal short axis (PSAX), however, it should be noted that the American Society of Echocardiography also endorses FAC calculation through the apical four-chamber view (A4C)23.
At the PSAX (at the level of the papillary muscles), obtain areas of the LV at end-diastole and end-systole. This can be done through the ultrasound software after freezing the image. The user can either trace the LV circumference or some machines will have an automated function that can trace and calculate the area. These values get plugged into the formula above to calculate your percentage change.
Normal values
Using an automated software for tracing the left ventricular cavity, Perez et al found that in healthy control subjects from a wide age range, the mean FAC was 55.6±11.2% and 34.7±7.8% taken through the PSAX and A4C, respectively24. More simply, calculators have been used with 40% FAC correlating with 54% LVEF25. Significantly abnormal values with an LVEF less than 30% may occur below an FAC of 25%25.
Limitations
Because FAC relies on tracings of the LV wall, regional wall abnormalities can over or under calculate LVEF. Regional wall motion abnormalities may not necessarily be captured in the plane you are making your measurement and lead to error.
Biplane (Simpson’s)
Introduction
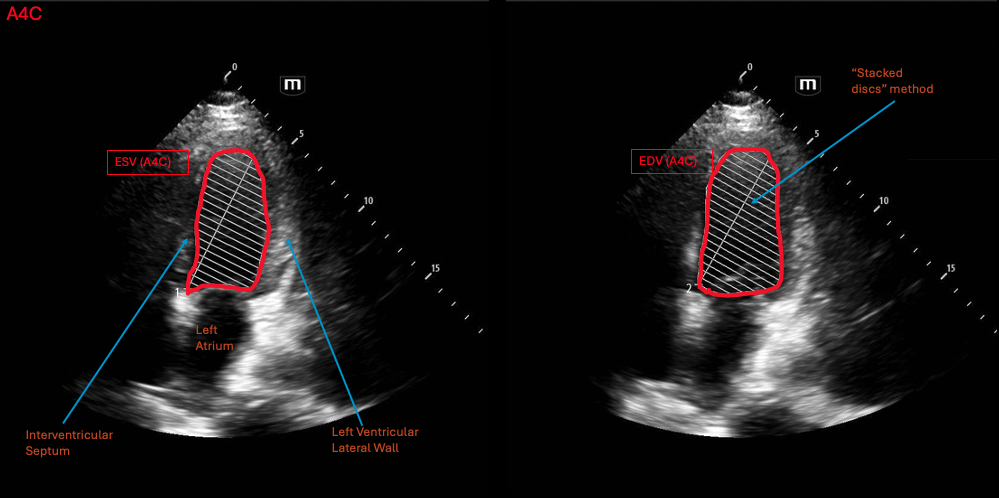
The Biplane method is the most accurate method for calculating LVEF through ultrasound. It takes measurements in mediolateral, posteroanterior, and longitudinal axes, providing three dimensions for volume calculations. Mathematically, this is done through a summation of the volume of stacked discs based on the measurements taken in these planes.
LVEF calculated through the biplane method was found to have a high correlation to those calculated with angiography and more accurate in calculating LVEF compared to methods using M-mode, particularly in patients with focal wall abnormalities26.
How to do
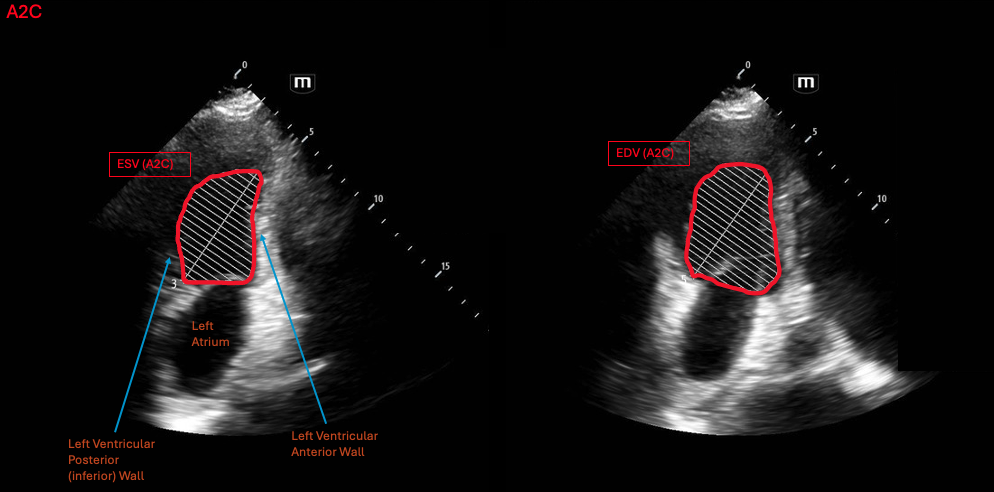
The biplane method requires two views, one in the A4C for the mediolateral measurements and another in the apical 2 chamber view (A2C) for the posteroanterior measurements of the heart. Both these planes also measure length of the LV in the base-apex axis.
Similar to FAC, the LV border is traced during end-diastole and end-systole. These tracings are taken in the A4C and A2C, resulting in a total of 4 tracings to make the final measurement. The ultrasound will take these tracings, convert them to volume measurements and utilize this to estimate an ejection fraction.
Normal values
Since the biplane method calculates volumes, the normal parameters are the normal values for LVEF. The normal range for LVEF is 55-69% and severely reduced LVEF is <30%.
Limitations
Besides the tedious nature of obtaining the measurements required for this method, the main limiting factor is time and subsequently obtaining adequate image quality. As previously mentioned, although this method can be accurate in patients with regional wall abnormalities, it still relies on high-quality tracings of the LV cavity. Therefore, image quality and acquisition by the user can be the greatest source of error in calculating LVEF through this method.
Artificial Intelligence
Application of artificial intelligence in ultrasound and POCUS is growing with many models are already being used clinically to estimate LVEF. From automating caliper measurements on M-mode to calculating “AutoEF” from a live A4C image, AI is used in varying degrees of automation during imaging and LVEF estimation.
Although these applications in automating LVEF estimation are feasible and can aid in simplifying LVEF calculations for clinicians, AI-enhanced echo is still in its very early stages and face many problems27. More work in developing more accurate models that also identifies and accounts for inter-user variations in image acquisition is still needed27. This, however, should not disqualify the use of AI in POCUS. Since they have been shown to correlate well with non-AI-assisted echo measurements, they can be useful in a pinch but results should be taken interpreted carefully and be verified through other studies or methods. We have included a video clip of an AI-enhanced machine tracing the LV wall to calculate an “Auto-EF” below for reference.

Case Conclusion
After placing the patient on oxygen and while waiting for labs, the patient continues to have shortness of breath and asks for an explanation for his symptoms. You bring in the ultrasound machine and see that his EPSS is elevated and measure it to be 13mm, but you are surprised given the patient is relatively young. Deciding to verify with another method, you calculate his fractional shortening to be 15%. You are convinced this is new heart failure, likely methamphetamine induced, and not COPD. The patient is started on diuretics and you consult cardiology.
Labs come back notable for markedly elevated BNP and cardiology and the patient are both thankful for starting the patient on diuretics in the ED. The patient is admitted for new onset heart failure and formal echo shows a markedly reduced LVEF by biplane method. The patient is stabilized and started on GDMT.
Summary
In the intermediate-risk heart failure patient disposition planning may not be as clear. This is when semi-quantitative measurements can play a crucial role in risk-stratification and management decisions.
Although each of these measurements have their own limitations and no one method is the superior, when used together with other studies and methods, they can provide valuable data points. Another limitation to note is that none of these measurements aid with diagnosis of heart failure patients with preserved ejection fraction. See our EMDocs article about diastology for POCUS studies useful in diagnosing and risk stratifying these patients (https://www.emdocs.net/ultrasound-g-e-l-e-e-for-acute-heart-failure/).
Practicing and having 2-3 of these measurements in an emergency physician’s skill set can provide valuable tools in the management of heart failure patients. We suggest using these semi-quantitative measurements and seeing which work well for your practice in terms of efficiency, patient population, and skill levels.
References
- Klaeboe LG, Edvardsen T. Echocardiographic assessment of left ventricular systolic function. J Echocardiogr. 2019;17(1):10-16. doi:10.1007/s12574-018-0405-5
- Kagiyama N, Abe Y, Kusunose K, et al. Multicenter validation study for automated left ventricular ejection fraction assessment using a handheld ultrasound with artificial intelligence. Sci Rep. 2024;14:15359. doi:10.1038/s41598-024-65557-5
- Ünlüer EE, Karagöz A, Akoğlu H, Bayata S. Visual Estimation of Bedside Echocardiographic Ejection Fraction by Emergency Physicians. West J Emerg Med. 2014;15(2):221-226. doi:10.5811/westjem.2013.9.16185
- Shahgaldi K, Gudmundsson P, Manouras A, Brodin LÅ, Winter R. Visually estimated ejection fraction by two dimensional and triplane echocardiography is closely correlated with quantitative ejection fraction by real-time three dimensional echocardiography. Cardiovasc Ultrasound. 2009;7(1):41. doi:10.1186/1476-7120-7-41
- Massie BM, Schiller NB, Ratshin RA, Parmley WW. Mitral-septal separation: New echocardiographic index of left ventricular function. Am J Cardiol. 1977;39(7):1008-1016. doi:10.1016/S0002-9149(77)80215-4
- Ahmadpour H, Shah AA, Allen JW, Edmiston WA, Kim SJ, Haywood LJ. Mitral E point septal separation: A reliable index of left ventricular performance in coronary artery disease. Am Heart J. 1983;106(1, Part 1):21-28. doi:10.1016/0002-8703(83)90433-7
- Ma and Mateer’s Emergency Ultrasound, 3e | AccessEmergency Medicine | McGraw Hill Medical. Accessed April 9, 2025. https://accessemergencymedicine.mhmedical.com/book.aspx?bookid=686
- Simonson JS, Schiller NB. Descent of the Base of the Left Ventricle: An Echocardiographic Index of Left Ventricular function. J Am Soc Echocardiogr. 1989;2(1):25-35. doi:10.1016/S0894-7317(89)80026-4
- Ballo P, Quatrini I, Giacomin E, Motto A, Mondillo S. Circumferential Versus Longitudinal Systolic Function in Patients with Hypertension: A Nonlinear Relation. J Am Soc Echocardiogr. 2007;20(3):298-306. doi:10.1016/j.echo.2006.08.024
- Schick AL, Kaine JC, Al-Sadhan NA, et al. Focused cardiac ultrasound with mitral annular plane systolic excursion (MAPSE) detection of left ventricular dysfunction. Am J Emerg Med. 2023;68:52-58. doi:10.1016/j.ajem.2023.03.018
- Matos J, Kronzon I, Panagopoulos G, Perk G. Mitral Annular Plane Systolic Excursion as a Surrogate for Left Ventricular Ejection Fraction. J Am Soc Echocardiogr. 2012;25(9):969-974. doi:10.1016/j.echo.2012.06.011
- Alam M, Höglund C, Thorstrand C, Helekant C. Haemodynamic significance of the atrioventricular plane displacement in patients with coronary artery disease. Eur Heart J. 1992;13(2):194-200. doi:10.1093/oxfordjournals.eurheartj.a060146
- Silva JA, Khuri B, Barbee W, Fontenot D, Cheirif J. Systolic excursion of the mitral annulus to assess septal function in paradoxic septal motion. Am Heart J. 1996;131(1):138-145. doi:10.1016/S0002-8703(96)90062-9
- Alam M, Höglund C, Thorstrand C, Philip A. Atrioventricular plane displacement in severe congestive heart failure following dilated cardiomyopathy or myocardial infarction. J Intern Med. 1990;228(6):569-575. doi:10.1111/j.1365-2796.1990.tb00281.x
- Wenzelburger FWG, Tan YT, Choudhary FJ, Lee ESP, Leyva F, Sanderson JE. Mitral annular plane systolic excursion on exercise: a simple diagnostic tool for heart failure with preserved ejection fraction. Eur J Heart Fail. 2011;13(9):953-960. doi:10.1093/eurjhf/hfr081
- Hu K, Liu D, Herrmann S, et al. Clinical implication of mitral annular plane systolic excursion for patients with cardiovascular disease. Eur Heart J – Cardiovasc Imaging. 2013;14(3):205-212. doi:10.1093/ehjci/jes240
- Quinones MA, Waggoner AD, Reduto LA, et al. A new, simplified and accurate method for determining ejection fraction with two-dimensional echocardiography. Circulation. 1981;64(4):744-753. doi:10.1161/01.cir.64.4.744
- Teichholz LE, Kreulen T, Herman MV, Gorlin R. Problems in echocardiographic volume determinations: Echocardiographic-angiographic correlations in the presence or absence of asynergy. Am J Cardiol. 1976;37(1):7-11. doi:10.1016/0002-9149(76)90491-4
- Lang RM, Bierig M, Devereux RB, et al. Recommendations for Chamber Quantification: A Report from the American Society of Echocardiography’s Guidelines and Standards Committee and the Chamber Quantification Writing Group, Developed in Conjunction with the European Association of Echocardiography, a Branch of the European Society of Cardiology. J Am Soc Echocardiogr. 2005;18(12):1440-1463. doi:10.1016/j.echo.2005.10.005
- Mertens L, Singh G, Armenian S, et al. Multimodality Imaging for Cardiac Surveillance of Cancer Treatment in Children: Recommendations From the American Society of Echocardiography. J Am Soc Echocardiogr. 2023;36(12):1227-1253. doi:10.1016/j.echo.2023.09.009
- Carr KW, Engler RL, Forsythe JR, Johnson AD, Gosink B. Measurement of left ventricular ejection fraction by mechanical cross-sectional echocardiography. Circulation. 1979;59(6):1196-1206. doi:10.1161/01.CIR.59.6.1196
- Liu N, Darmon PL, Saada M, et al. Comparison between Radionuclide Ejection Fraction and Fractional Area Changes Derived from Transesophageal Echocardiography Using Automated Border Detection. Anesthesiology. 1996;85(3):468-474. doi:10.1097/00000542-199609000-00004
- Mitchell C, Rahko PS, Blauwet LA, et al. Guidelines for Performing a Comprehensive Transthoracic Echocardiographic Examination in Adults: Recommendations from the American Society of Echocardiography. J Am Soc Echocardiogr. 2019;32(1):1-64. doi:10.1016/j.echo.2018.06.004
- Pérez JE, Klein SC, Prater DM, et al. Automated, on-line quantification of left ventricular dimensions and function by echocardiography with backscatter imaging and lateral gain compensation. Am J Cardiol. 1992;70(13):1200-1205. doi:10.1016/0002-9149(92)90056-5
- Fractional Area Change (FAC). Accessed December 26, 2024. https://www.e-echocardiography.com/calculators/myocardial-performance/fractional-area-change-fac
- Schiller NB, Acquatella H, Ports TA, et al. Left ventricular volume from paired biplane two-dimensional echocardiography. Circulation. 1979;60(3):547-555. doi:10.1161/01.cir.60.3.547
- Zhang Z, Zhu Y, Liu M, et al. Artificial Intelligence-Enhanced Echocardiography for Systolic Function Assessment. J Clin Med. 2022;11(10):2893. doi:10.3390/jcm11102893