
Author: Brit Long, MD (@long_brit – EM Chief Resident at SAUSHEC, USAF) // Edited by: Alex Koyfman, MD (@EMHighAK – EM Attending Physician, UTSW / Parkland Memorial Hospital) and Manpreet Singh, MD (@MPrizzleER – Clinical Instructor & Ultrasound/Med-Ed Fellow / Harbor-UCLA Medical Center)
It’s been a busy day in the ED, full of sick patients requiring resuscitation. You just intubated a patient in respiratory distress with COPD who failed a trial of noninvasive positive pressure ventilation. The intubation went well, and you are now securing your ETT and connecting end-tidal waveform capnography to evaluate the tracing. The chest X-ray shows optimal position of the ETT, you have the post-procedural analgesia and sedative agents on board, and you’re feeling good as you exit the resuscitation bay.
The next patient is an 8 year-old male with a fall and forearm deformity. X-ray reveals an angulated, mid-shaft radial fracture that will need reduction. You evaluate the patient for the necessary procedural sedation, gather your equipment and airway supplies, and prepare for the sedation. You plan on using ketamine. Before you push the ketamine, you have the patient on monitors, including waveform capnography.
Background
Capnography has shown great potential in several conditions and procedures in emergency medicine. Literature exists for its use in cardiopulmonary resuscitation, intubation for confirmation of ETT placement, resuscitation of critically ill patients with sepsis, monitoring response to treatment in patients with respiratory distress (specifically COPD, CHF, and asthma), pulmonary embolism, and procedural sedation. For more details, go HERE.
However, how do you interpret quantitative capnography waveforms? We own the resuscitation of critically ill patients, and with boarding increasing in EDs, we need to know how to interpret waveforms. This instrument can provide a great deal of important information if properly understood.
The normal capnography waveform
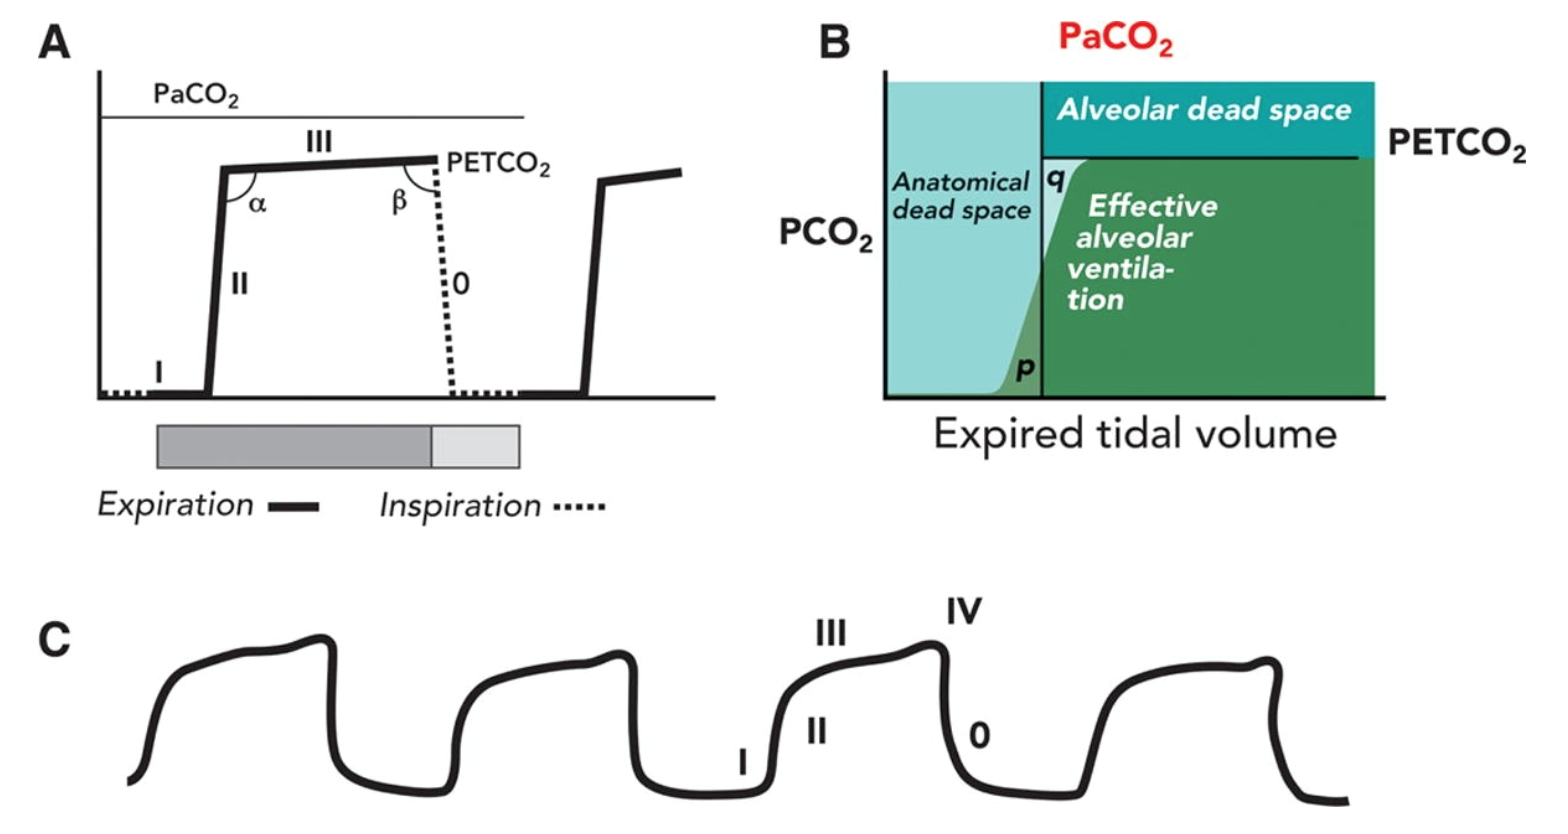
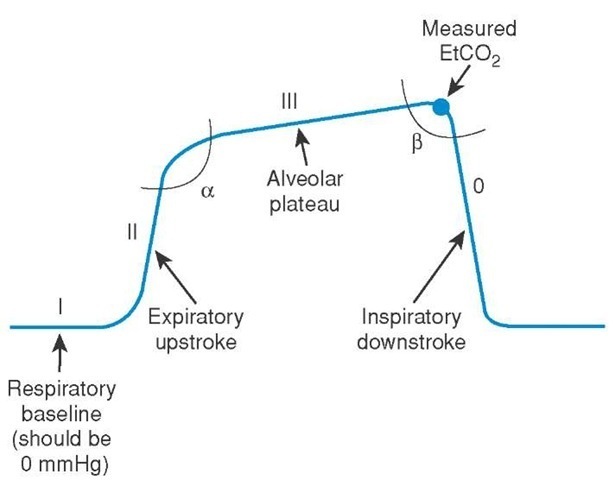
The main determinants of ETCO2 include alveolar ventilation, pulmonary perfusion, and CO2 production. A normal waveform has four different phases:
- Phase I is the inspiratory baseline, which is due to inspired gas with low levels of CO2.
- Phase II is the beginning of expiration which occurs when the anatomic dead space and alveolar gas from the alveoli/bronchioles transition.
a. The transition from phase II to III is the alpha angle.
b. The alpha angle can be used to assess the ventilation/perfusion of the lung. V/Q mismatches will have an alpha angle greater than 90 degrees. - Phase III is the alveolar plateau, where the last of the alveolar gas is sampled. This is normally the PETCO2.
a. The transition from phase III to 0 is the beta angle.
b. The beta angle can be used to assess rebreathing. If rebreathing occurs, the angle is greater than 90 degrees. - This is actually phase 0, reflecting the inspiratory downstroke and the beginning of inspiration.
Of note, an additional phase IV is often seen in pregnancy, which is a quick upstroke before phase 0 begins.
How do you analyze the waveform?
Just like you evaluate an ECG or chest Xray, I recommend using an algorithm or systematic process for analysis. This can be divided into several steps:
- Look for presence of exhaled CO2 (Is a waveform present?)
- Inspiratory baseline (Is there rebreathing?)
- Expiratory upstroke (What is the shape i.e. steep, sloping, or prolonged?)
- Expiratory/alveolar plateau (Is it sloping, steep, or prolonged?)
- Inspiratory downstroke (Is it sloping, steep, or prolonged)
Ensure you evaluate the height, frequency, rhythm, baseline, and shape. With these thoughts in mind, let’s discuss some clinical scenarios.
Cases…
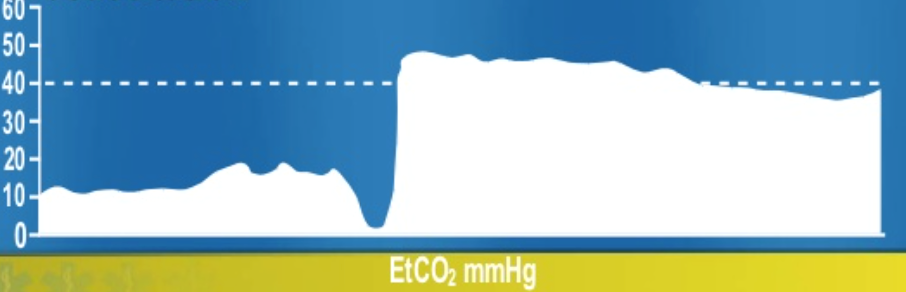
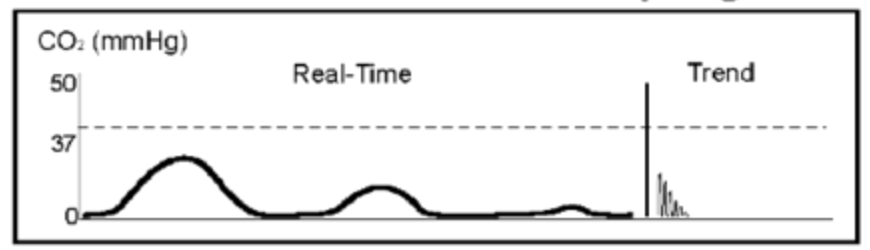
Before you can reassess your other two patients, you receive an EMS radio call. They were called to the scene of a patient in PEA, and they have started compressions and will be at your doorstep in 3 minutes. The patient arrives, with the crew doing high quality CPR. The patient continues with no pulse, leads and ETCO2 are connected, one amp of epinephrine is given, and US shows a heart rate of 40 bpm. Your waveform capnography shows 10 mm Hg, and the person completing CPR is tiring. As the team leader, you ask another team member to take over.
This waveform with a dip shows the time to transition to a different provider, with improved perfusion with the new provider doing compressions, as the CO2 has increased indicating better tissue perfusion.
After another minute of CPR, the ETCO2 jumps to 40. A sudden increase in ETCO2 is seen in ROSC during arrest or correction of an ETT obstruction.
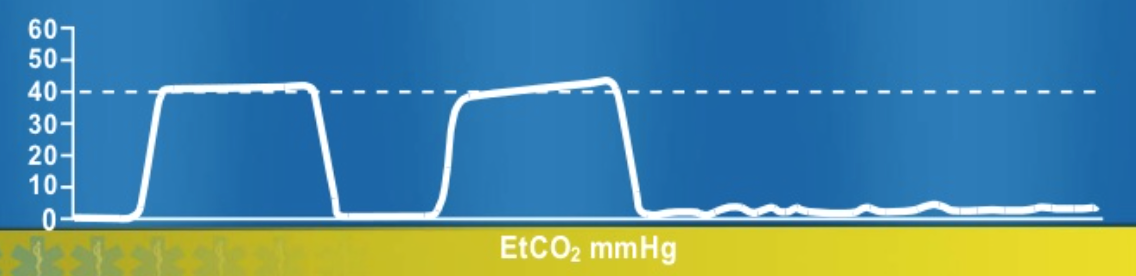
You now have return of pulses and are preparing to intubate the patient. Unfortunately, the resident completing it is not confident in his view and is unsure of tube placement. Your waveform shows the following:
This waveform shows a tapering of the ETCO2, suggestive of esophageal intubation. You ask the resident to remove the ETT. He obtains an improved view with videoscope and passes the ETT without difficulty. The waveform looks normal, and the patient is now stable.
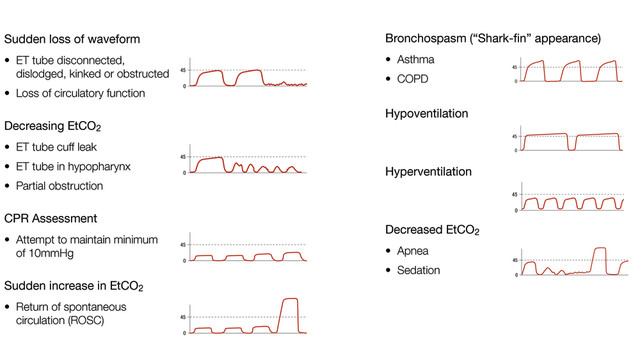
Finally you have time to go reassess your COPD patient. Just as you enter the resuscitation bay, he has a desaturation to 88% while on FiO2 of 100%, and your waveform is flat.
You are now pretty tired of these flat waveforms, and you immediately curb your sphincter response while running to the bedside. Your mind quickly goes through the DOPES mnemonic (displacement, obstruction, PTX, equipment failure, breath stacking) and you see that while moving the patient, the ETT became disconnected from the circuit. You reconnect, with increase in saturation and good waveform.
What are other causes of a sudden flat EtCO2 tracing?
Extubation, capnography not connected to circuit, cardiorespiratory arrest, apnea test in brain dead patient, obstruction of capnography, ventilator disconnection, and esophageal intubation.
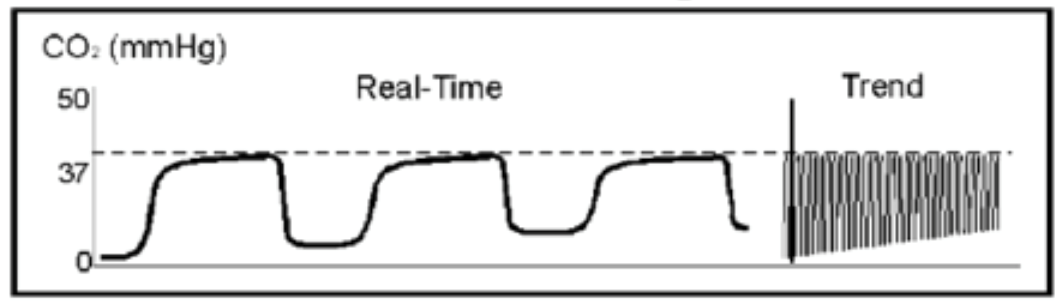
After caring for an ankle sprain and beginning the workup of a patient with chest pain, you again reassess the patient with COPD. You notice a steadily increasing EtCO2 baseline in your COPD patient. The waveform looks like this…
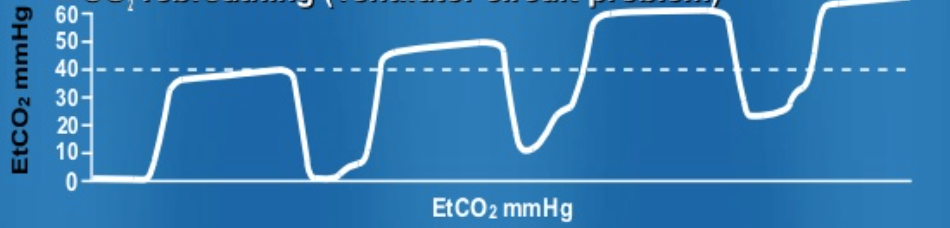
The waveform reflects an elevation of baseline, as well as the plateau, indicating incomplete exhalation. The CO2 is not being appropriately removed. This is often due to insufficient expiratory time, inadequate inspiratory flow, or faulty expiratory valve.
Rebreathing can also appear with the following waveform with baseline elevation, which is due to inadequate exchange of CO2.
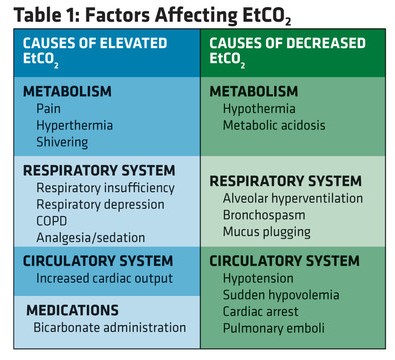
Increased EtCO2 can be due to four components:
- Increased CO2 production (fever, NaHCO3 administration, tourniquet release, and overfeeding syndrome).
- Pulmonary perfusion increase (increased cardiac output, increased blood pressure).
- Alveolar ventilation decrease (hypoventilation, bronchial intubation (remember that victory shove?), partial airway obstruction, rebreathing).
- Equipment malfunction (exhausted CO2 absorber, inadequate fresh gas flow, ventilator tubing leak, ventilator malfunction).
Once you slow down his respiratory rate and increase the flow rate, his saturations and waveform improve. Suddenly, the alarm alerts you to high pressures in the circuit, and his waveform shows:
This waveform is due to obstruction of the ETT, either through ETT kink, foreign body in airway, bronchospasm, or mucous plug. You see high peak pressures and suction the tube, while ordering an in-line duoneb. Five minutes later the patient again improves. You wipe the sweat from your brow, as this patient is keeping you busy.
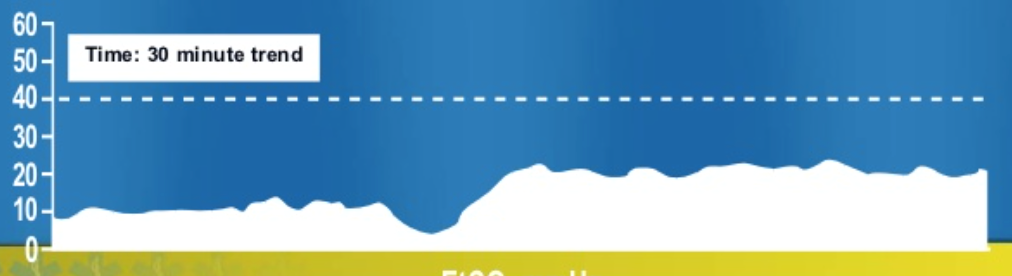
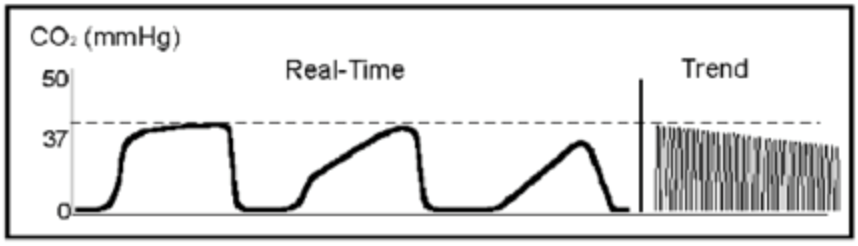
After all this excitement, you prepare for the sedation of the 8 year-old male with forearm fracture requiring reduction. The sedation and reduction go smoothly with ketamine. He is starting to wake from his dissociative state, and you see this:
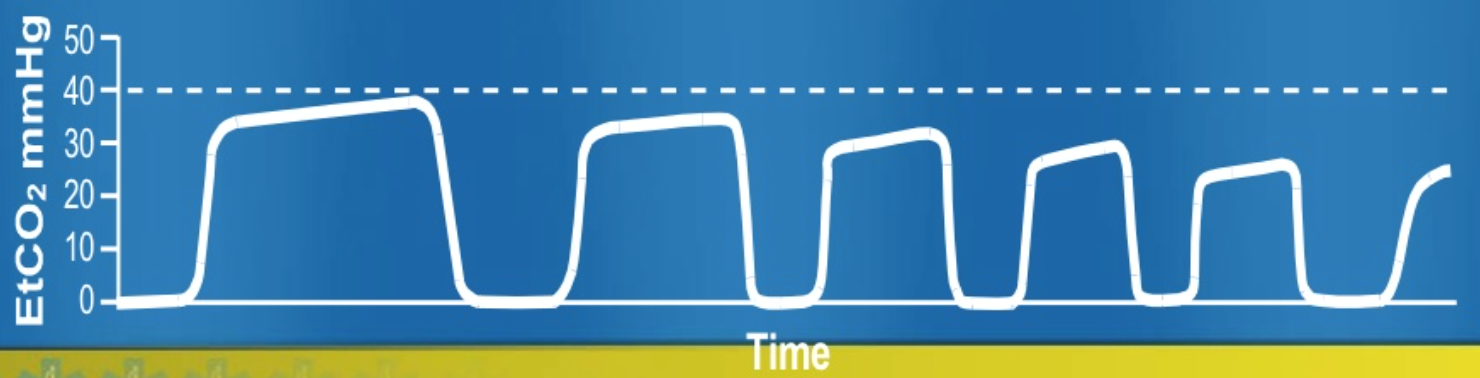
This waveform demonstrates hyperventilation. Notice the baseline is unchanged. This waveform shows steadily decreasing plateau, reflecting tachypnea, increase in tidal volume, decreased metabolic rate, or fall in body temperature.
A decreasing EtCO2 has several etiologies:
- Decreased CO2 production (hypothermia)
- Pulmonary perfusion decrease (reduced cardiac output, hypotension, pulmonary embolism, cardiac arrest)
- Alveolar ventilation increase (hyperventilation, apnea, total airway obstruction, extubation)
- Apparatus malfunction (circuit disconnection, leak in sampling, ventilator malfunction)
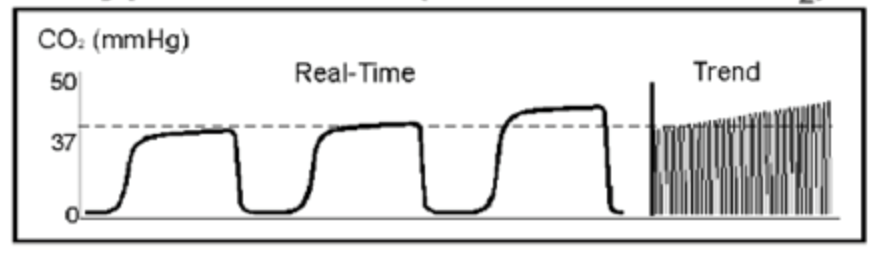
What if his respiratory rate had started to decrease?
The alveolar plateau will begin to steadily increase, which is due to decrease in respiratory rate, decreased tidal volume, increased metabolic rate, and hyperthermia. Notice the baseline is still close to 0, so CO2 is appropriately exchanged.
Just before you send the COPD patient to the ICU, the nurse grabs you, as the waveform has now changed.
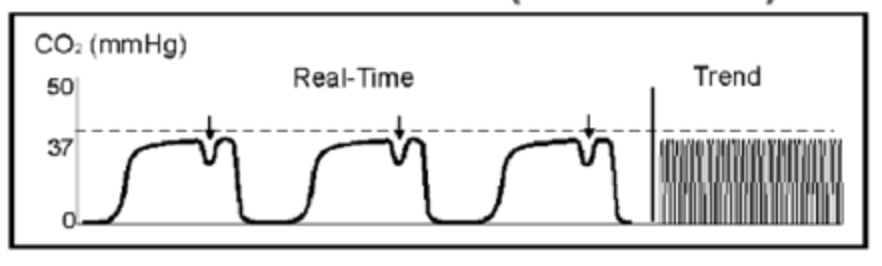
This small dip in the alveolar plateau is known as a “curare cleft.” This waveform appears when the paralytic begins to subside and the patient tries to breathe during partial paralysis. You increase the analgesic drip, and the patient is transferred to the ICU.
Summary
Use an algorithm for waveform capnography analysis.
- Look for presence of exhaled CO2 (Is a waveform present?)
- Inspiratory baseline (Is there rebreathing?)
- Expiratory upstroke (What is the shape i.e. steep, sloping, or prolonged?)
- Expiratory/alveolar plateau (Is it sloping, steep, or prolonged?)
- Inspiratory downstroke (Is it sloping, steep, or prolonged)
Ensure you evaluate the height, frequency, rhythm, baseline, and shape.
Understanding waveforms and how to interpret them can provide a great deal of information. We are the masters of resuscitation, and this is a vital component of caring for critical patients.
References/Further Reading
-Kodali BS. Capnography outside the operating rooms. Anesthesiology. 2013 Jan;118(1):192-201.
-Thompson JE, Jaffe MB. Capnographic waveforms in the mechanically ventilated patient. Respir Care. 2005 Jan;50(1):100-8; discussion 108-9.
-Blanch L, Romero PV, Lucangelo U. Volumetric capnography in the mechanically ventilated patient. Minerva Anestesiol. 2006 Jun;72(6):577-85.
Online Resources
- EMS World
- Respiratory Update
- Paramedicine
- KIDoc
- SlideShare Presentation – Capnography Refresher by Eric Mayhew
- Jeremy Jaramillo
- Capnography Comprehensive Guide – Bhavani Shankar Kodali


10 thoughts on “Interpreting Waveform Capnography: Pearls and Pitfalls”
Hi that’s a great essay on capnography. Thank you for putting it up.it would nice if it would be downloadable or PDF format so that I save it.
Good Job Brit Kept the grey cells ticking over
Timely refresher, important to be well versed in interpreting waveforms
Thanks for the effort
Good Job Brit Kept the grey cells ticking over
Timely refresher, important to be well versed in interpreting waveforms
Thanks for the effort
Pingback: Asynchronous Learning: Resuscitation - Bold City Emergency Medicine
Pingback: etCO2 – Kapnografi – Översikt – Mind palace of an ER doc
Pingback: Understanding Capnography – Intensive Nurse
Pingback: La capnografía en Urgencias y Emergencias - Urgencias y Emergencias
Very useful, thank you so much.
Pingback: Capnografia na Emergência – Emergência Rules
Pingback: Elementor #4778