General Info/Intro
Wellens’ syndrome is a pattern of T-wave changes seen in the anterior leads on an EKG that is highly specific for critical stenosis of the left anterior descending (LAD) coronary artery.1,3,4,5
Wellens’ syndrome, also called LAD coronary T-wave syndrome, was first described in 1982 by a group of cardiologists in the Netherlands (de Zwaan, Bär, Wellens) who were investigating the management of patients admitted to the hospital for unstable angina. They described a subgroup of patients (26 of 145; 18%) with characteristic T-wave changes (described below) in the precordial leads (particularly V2 and V3) and negative cardiac enzymes that did poorly with conservative management.1
All patients received relief of chest pain with drug therapy. However, 8 of the first 9 patients, before the prognostic significance of the findings was recognized, developed an acute myocardial infarction (AMI), and 3 of those died. In total, 13 patients received cardiac catheterization and coronary angiography. Twelve of the 13 were found to have greater than 90% stenosis of the proximal LAD (two with complete blockage), and nine later underwent coronary artery bypass grafting to the LAD. Of the 7 who did not receive catheterization (due to either age or patient refusal), 4 developed AMI.
In a second prospective study performed by de Zwaan et al., 180 out of 1260 (14%) patients that were hospitalized for unstable angina were found to have this pattern of EKG changes. All 180 underwent catheterization and all 180 were found to have at least 50% blockage of the LAD.2 These studies show that patients presenting with this EKG pattern are at particularly high risk of developing an extensive myocardial infarction and therefore warrant special attention.
Recap Basics
Wellens’ syndrome is a preinfarction stage of coronary artery disease and heralds an impending extensive myocardial infarction of the anterior wall.1,3 It is typified by anginal chest pain, characteristic EKG changes that usually occur after chest pain has resolved, and negative cardiac biomarkers.
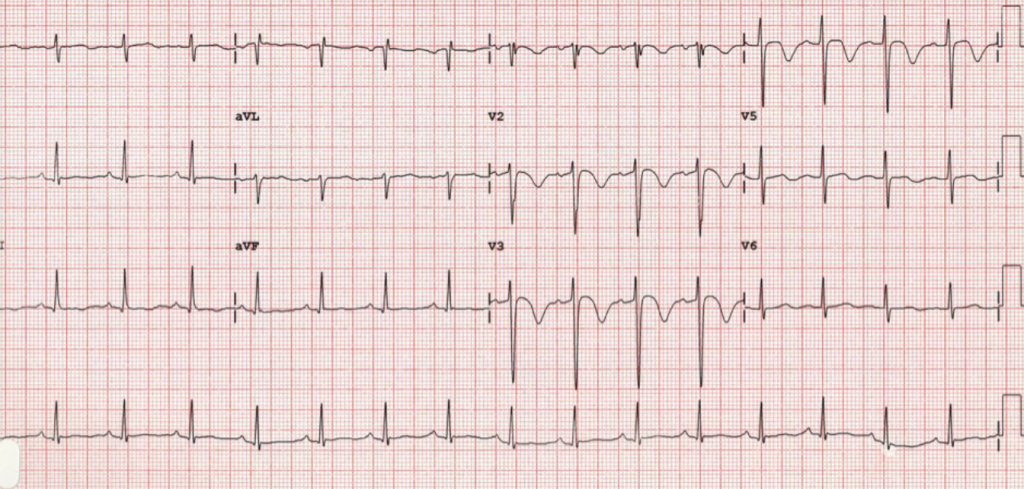
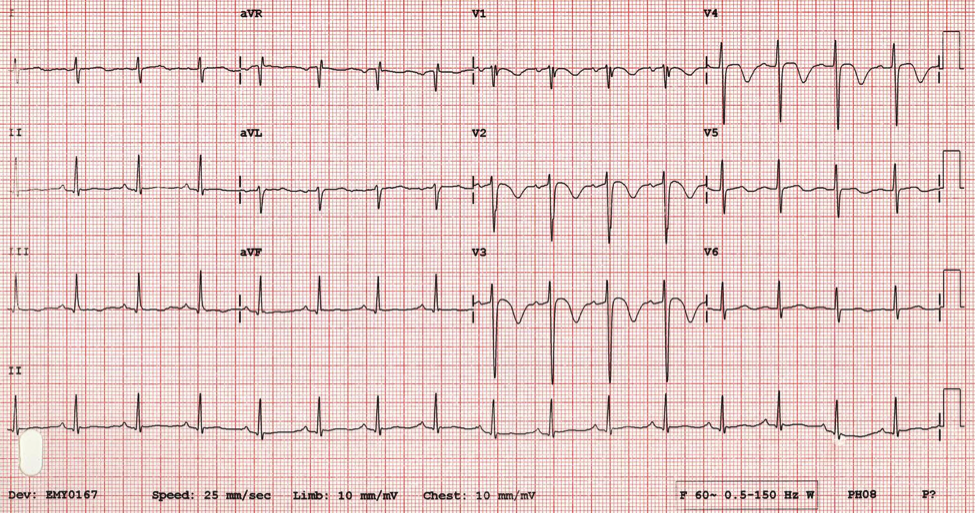
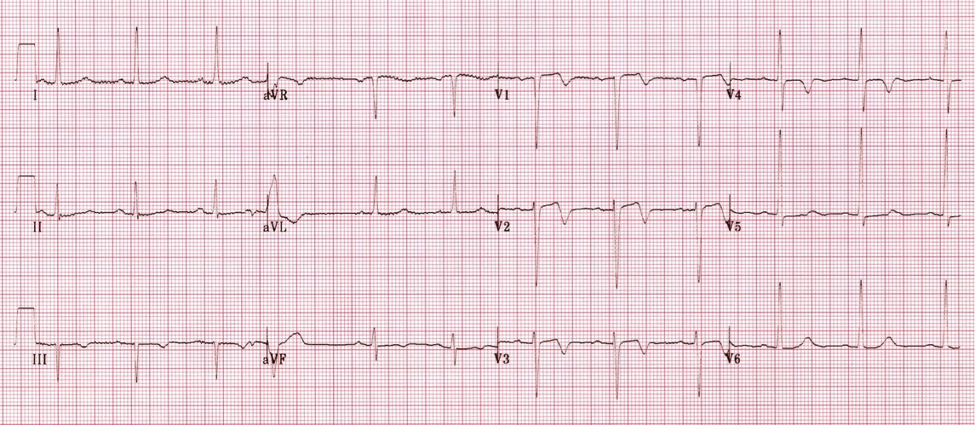
Wellens’ syndrome presents as one of two characteristic T-wave abnormalities on electrocardiography. Type B (approximately 75% of cases) shows deeply inverted and symmetric T-waves (figure 1). Type A (approximately 25% of cases) shows biphasic T-waves, with an initial positive deflection, and terminal negative deflection (figure 2). The ST segment is seldom involved, but when it is, consists of ST elevation of less than 1 mm.1,3 These changes are always seen in leads V2 and V3, but can be seen commonly in V4, less often in V1, and only occasionally seen in leads V5 and V6.2,3
Patients presenting with Wellens’ syndrome will generally have signs and symptoms of typical anginal chest pain and usually respond well to drug therapy (nitrates and morphine). What is unusual is that the EKG changes that are typical of Wellens’ syndrome typically appear after chest pain has resolved. In fact, during an acute attack of chest pain, the T-wave abnormalities will normalize or become ST-segment elevation.3
Left untreated, the patient presenting with Wellens’ syndrome has a significant risk of severe myocardial infarction and death. In de Zwaan et al’s initial study, of the patient’s presenting with this EKG pattern who had myocardial infarction, the infarction occurred within 1 to 23 days (mean of 8.5 days) of admission.1
What’s New
Since its initial description, Wellens’ syndrome has rapidly “become one of the essential instant recognition abnormalities on ECG.”5
Diagnostic criteria for Wellens’ Syndrome5:
- One of the two T-wave abnormalities described above
- History of chest pain
- Normal to minimally elevated cardiac enzymes
- No pathologic precordial Q waves
- Minimal to no ST elevation
- No loss of precordial R waves
Bottom Line/Pearls & Pitfalls
Stress testing – contraindicated in Wellens’ syndrome. Due to the location and degree of stenosis, stress testing may prove fatal. These patients need emergent angiography and intervention.3,5
Elevation of cardiac biomarkers – usually NOT seen in Wellens’ syndrome, and if present, usually less than twice the upper limit of normal.2 As patients will usually be chest pain free when the EKG changes are present, the T-wave abnormalities may be the ONLY indication of an impending significant myocardial infarction.3
Mimics of Wellens’ Syndrome
- Persistent Juvenile T-wave Pattern
- Normal variant. It is seen much more commonly in young women, especially African American women. Inverted T-waves (biphasic T-waves in some cases) appear in leads V1-V3; if appears in V4-V6, raises concern for ischemia. The inverted T-waves are not symmetric, and are less than 3 mm deep. A lot of children will show inverted T-waves on EKG. As the child grows and left ventricle increases in size, the T-waves will normalize. V1 may continue to be inverted into adulthood, which is normal. In some patient’s, this pattern continues into young adulthood, hence the name “persistent juvenile pattern.”6
- High Voltage
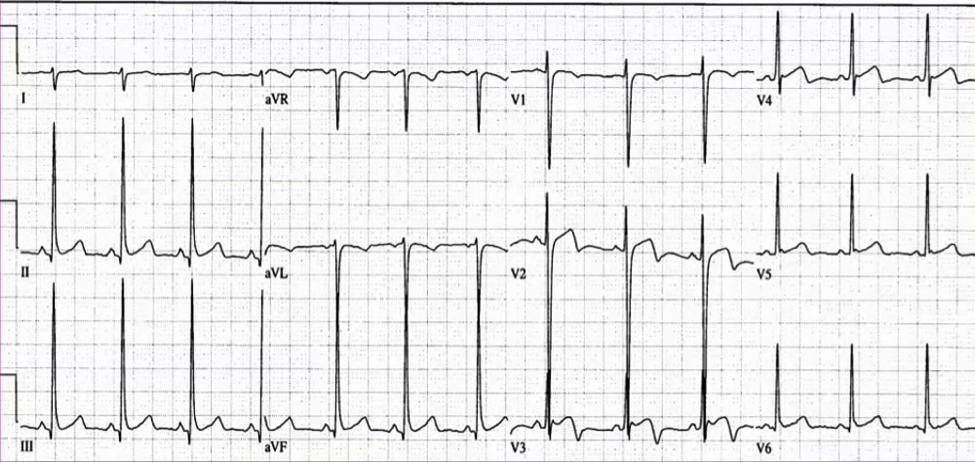
- A normal variant described by Dr. Amal Mattu, MD.7,8 Always seen in young males, particularly African American males. Can easily be mistaken for Wellens’ syndrome, however, QRS shows very high voltage and ends with a “fishhook” (a very small R’). The ST segment is concave upwards followed by a steep, downward drop in the T-wave (as opposed to flat or convex ST-segment in Wellens). QT interval tends to be short (figure 3).7,8
- Pulmonary Embolism
- Due to right heart strain, EKG can show inverted T-waves in leads V1-V4. May also show other signs of right heart strain, such as right axis deviation, right bundle branch block or the “S1Q3T3” pattern.
- Right Bundle Branch Block
- Delayed right ventricular depolarization gives rise to repolarization abnormalities in right precordial leads (V1-V3), such as T-wave inversion, and ST depression. Wellens’ does not occur with ST depression. Also, the EKG with RBBB will also show a secondary R wave (R’) in V1-V3 and widened QRS duration (>120 msec) in complete block.9
- CNS injury
- T-wave inversions can be seen in patients with CNS injury such as stroke, subarachnoid hemorrhage, or intracerebral hemorrhage and appear very similar to those seen in Wellens’. However, in an acute CNS insult, these also usually occur with ST-segment changes. QTc prolongation and U-waves are also commonly seen in CNS injury. Further history and physical exam should also aid in differentiating the two entities.
- Digitalis Effect
- Digitalis can cause biphasic or inverted T-waves on EKG. Most common T-wave abnormality is biphasic T-waves with initial negative deflection and positive terminal deflection (opposite the pattern seen in Wellens’), but is usually seen in leads with prominent R-waves (leads V4-V6). The morphology of the T-waves is a slow descending limb followed by a rapidly ascending terminal limb which may be peaked. More commonly associated with digoxin effect is a downsloping ST-segment with a characteristic “scooped” appearance and is usually contiguous with first part of T-wave.3,10
- Hypokalemia
- Biphasic T-waves can be seen in hypokalemia, however, the initial deflection of the T-wave is negative (as opposed to positive in Wellens’ Syndrome) followed by a positive deflection. Also look for U-waves.
Figures
Further Reading
- de Zwaan C, Bär FW, Wellens HJ. Characteristic electrocardiographic pattern indicating a critical stenosis high in left anterior descending coronary artery in patients admitted because of impending myocardial infarction. Am Heart J. 1982 Apr;103(4 Pt 2):730-6. PMID: 6121481.
- de Zwaan C, Bär FW, Janssen JH, et al: Angiographic and clinical characteristics of patients with unstable angina showing an ECG pattern indicating critical narrowing of the proximal LAD coronary artery. Am Heart J 1989;117:657-665.
- Rhinehardt J, Brady WJ, Perron AD, Mattu A. Electrocardiographic manifestations of Wellens’ syndrome. Am J Emerg Med. 2002 Nov;20(7):638-43.
- Cadogan M, Nickson C. Wellens’ Syndrome. Life in the Fastlane. Retrieved November 18, 2013 from http://lifeinthefastlane.com/ecg-library/wellens-syndrome/.
- Allely P. (2009, September 15). What is Wellens’ Syndrome?. Life in the Fastlane. Retrieved November 18, 2013 from http://lifeinthefastlane.com/what-is-wellens-syndrome/.
- Mattu A. (2011, October 2). Persistent Juvenile T-wave Pattern. Emergency ECG Video of the Week. Retrieved November 23, 2013 from http://ekgumem.tumblr.com/post/17949987383/persistent-juvenile-t-wave-pattern-episode.
- Mattu A. (2012, April 3). Must know Wellens’ Syndrome mimic. Emergency ECG Video of the Week. Retrieved November 23, 2013 from http://ekgumem.tumblr.com/post/20440438902/must-know-wellens-syndrome-mimic-episode.
- Wang, et al. ST-segment elevation in conditions other than acute myocardial infarction. N Engl J Med 2003;349:2128-2135.
- Cadogan M, Nickson C. Right Bundle Branch Block. Life in the Fastlane. Retrieved December 28, 2013 from http://lifeinthefastlane.com/ecg-library/basics/right-bundle-branch-block/.
- Burns E. Digoxin Effect. Life in the Fastlane. Retrieved November 24, 2013 from http://lifeinthefastlane.com/ecg-library/digoxin-effect/.
- http://www.ncbi.nlm.nih.gov/pubmed/23585602
- http://www.ncbi.nlm.nih.gov/pubmed/23079146
- http://www.ncbi.nlm.nih.gov/pubmed/20580877
- http://www.ncbi.nlm.nih.gov/pubmed/21106319